Analytics
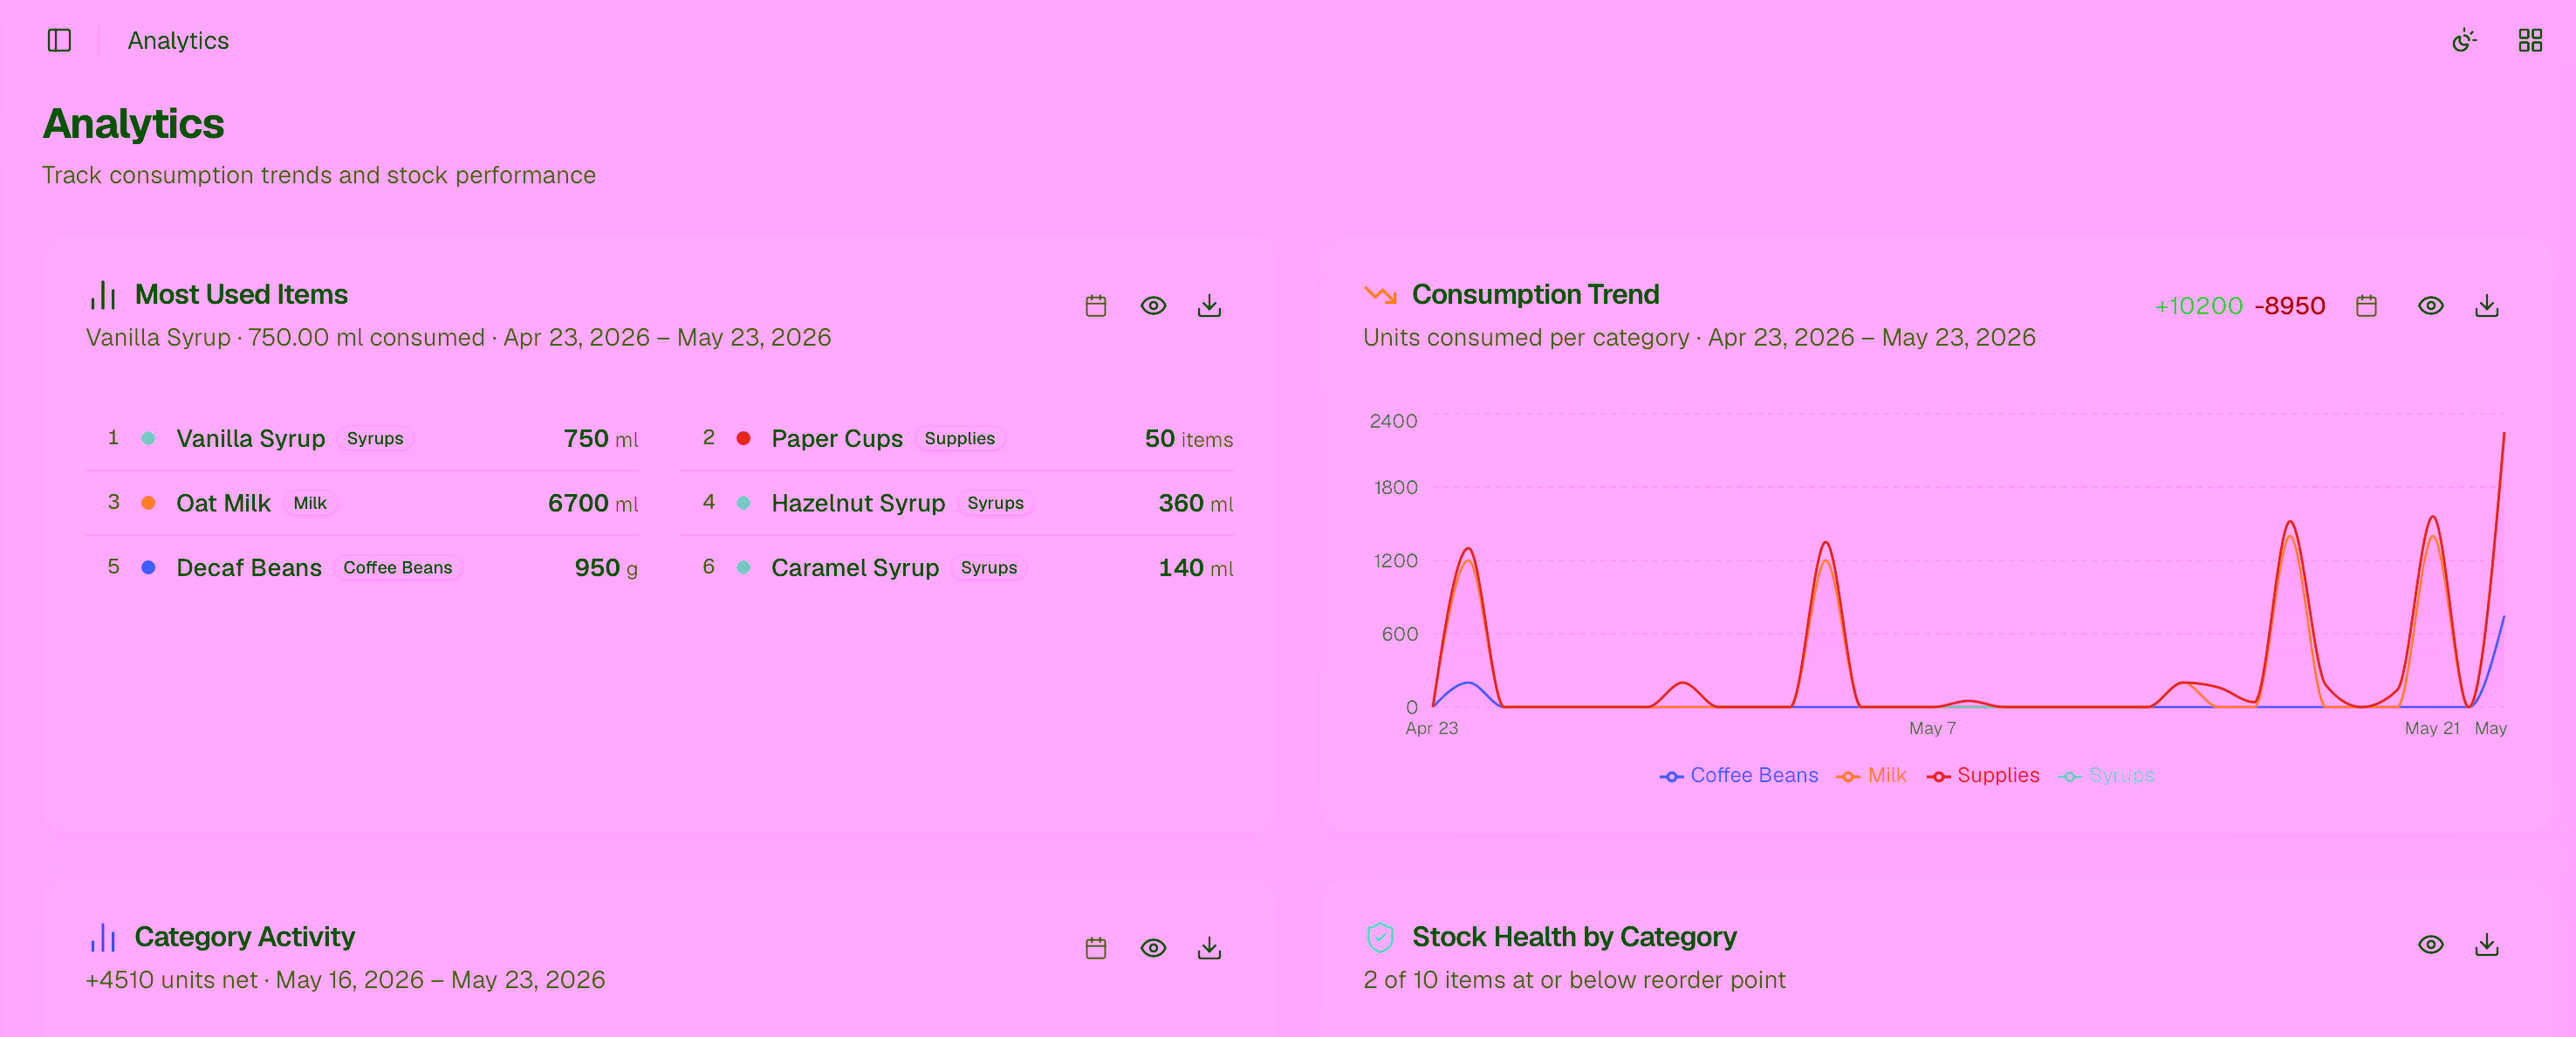
The Analytics page surfaces trends and patterns in your inventory data — consumption rates, stock health, waste, and usage by category, location, and day of the week.
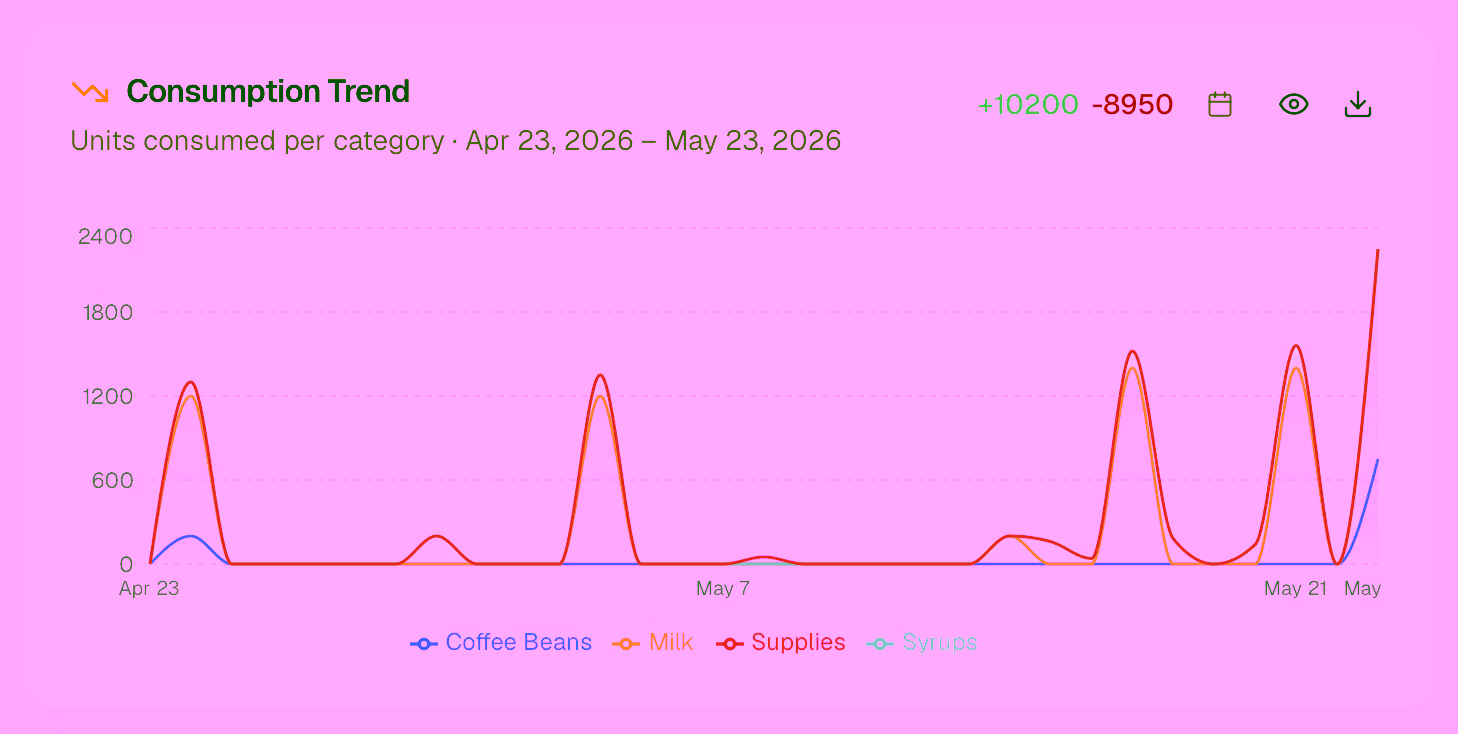
Consumption Trends
A time-series chart showing how quickly each item (or category) is being used over the selected date range. Spikes can indicate unusual usage or a data entry error worth investigating.
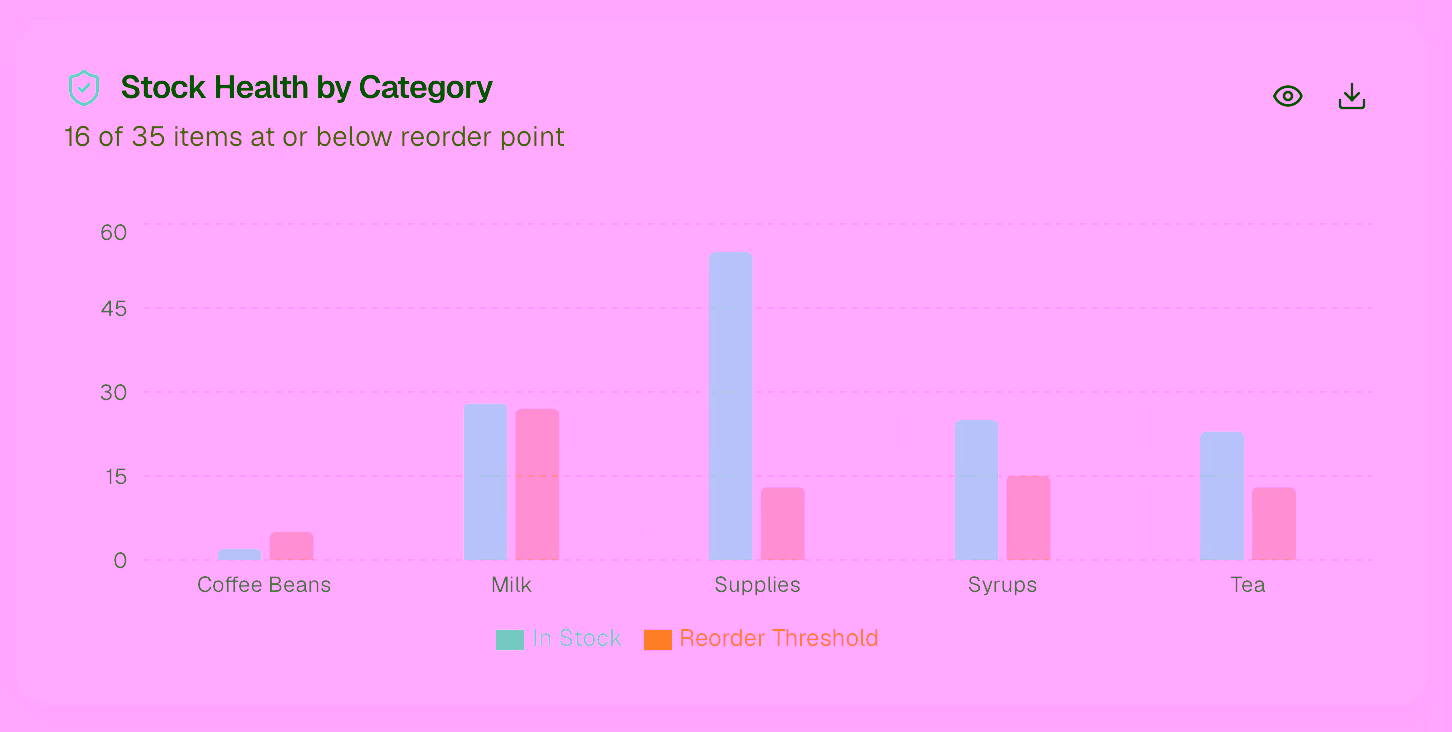
Stock Health
A breakdown of all items by status: Healthy, Low, and Out of stock. Hover over a segment to see the specific items in that group.
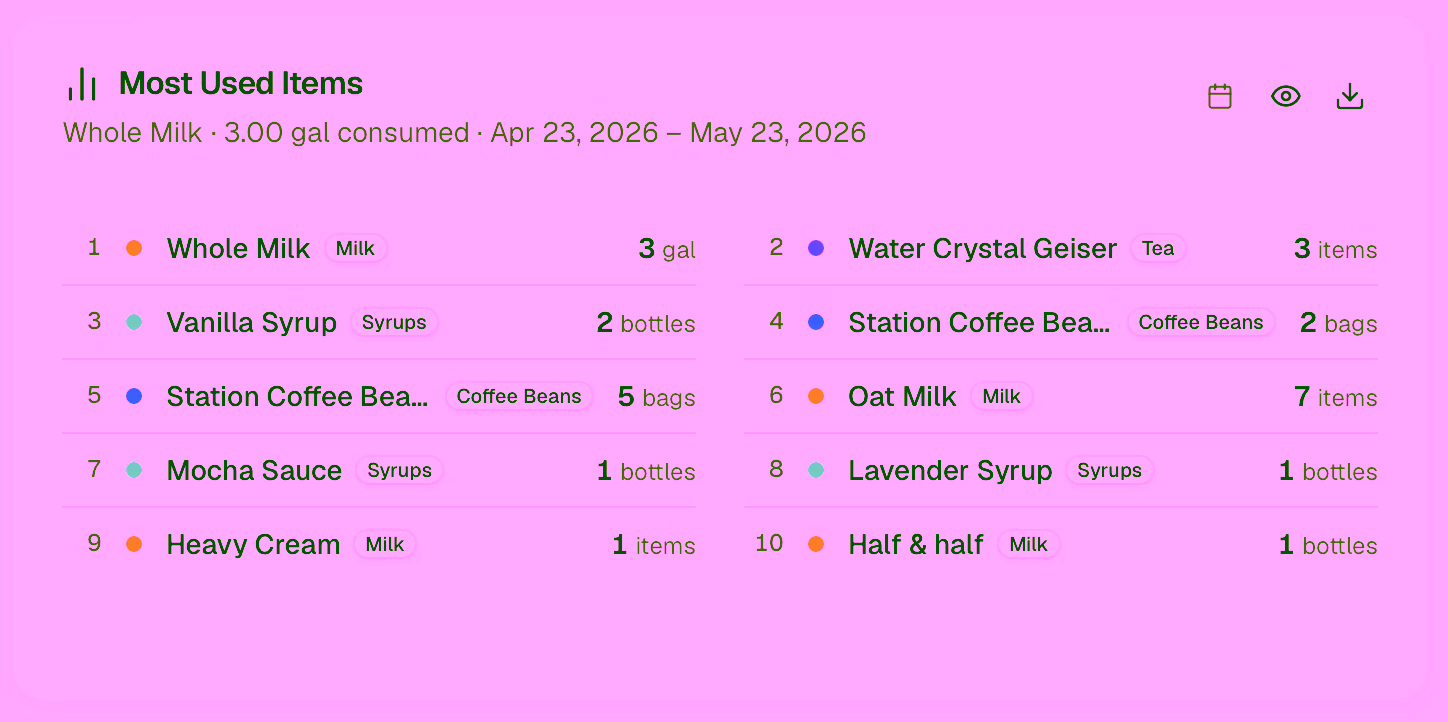
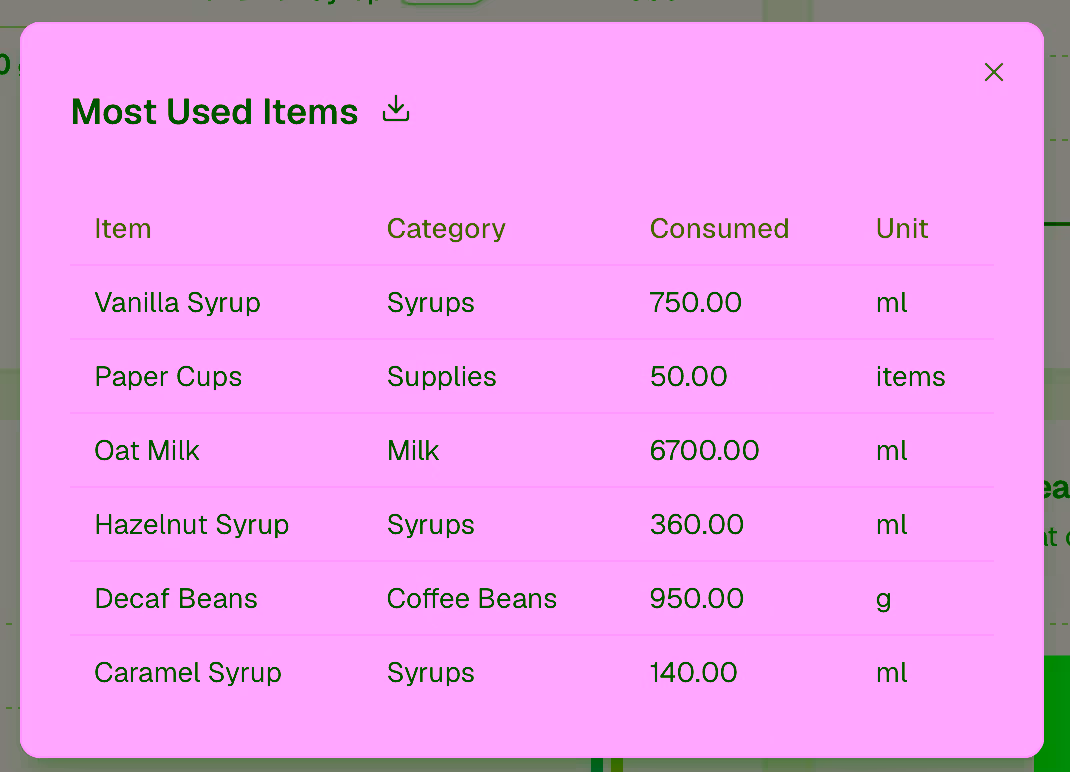
Most-Used Items
A ranked list of the items consumed at the highest rate over the period. Use this to prioritize reorder schedules and avoid running out of your most critical ingredients.
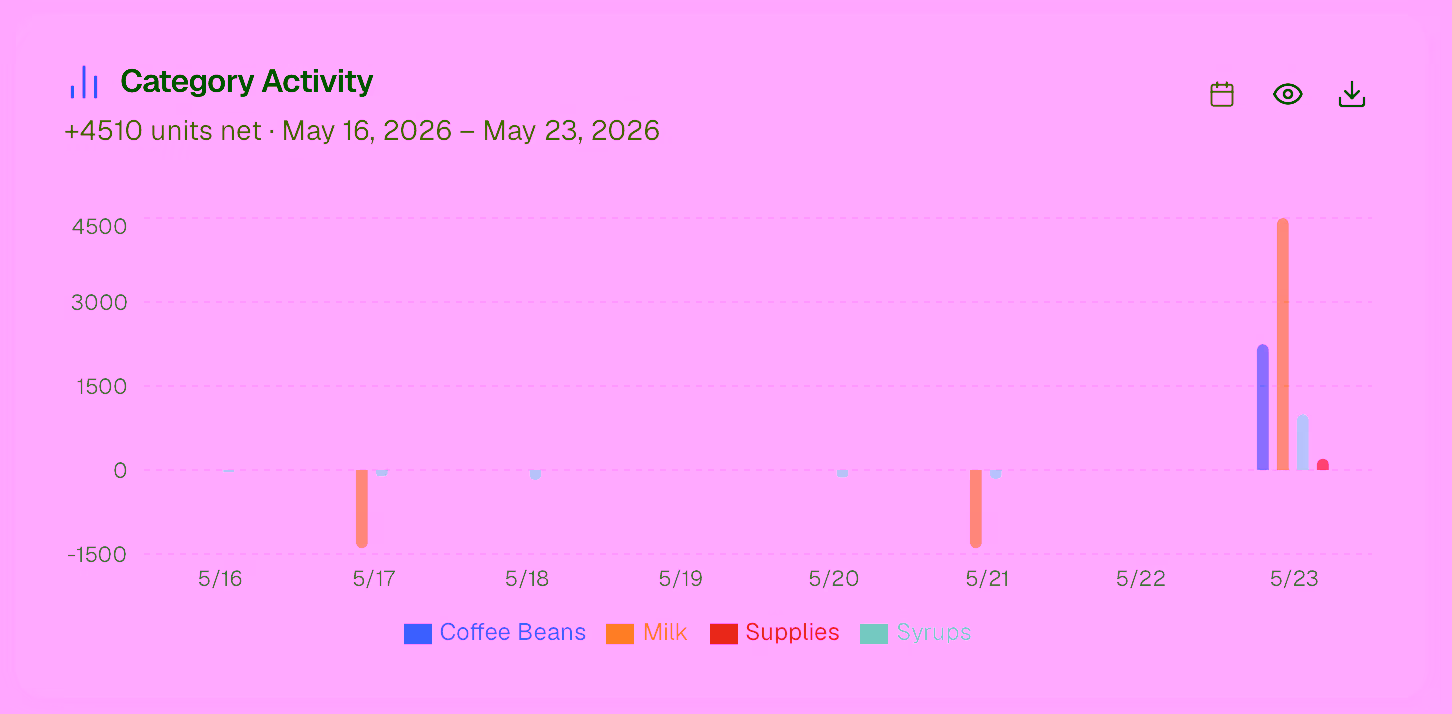
Category Activity
Compares consumption volume across item categories (e.g., Dairy, Syrups, Packaging). Useful for spotting which categories need more frequent counts.
Location Breakdown
If you have multiple locations, this panel compares usage side-by-side so you can see which store moves inventory fastest.

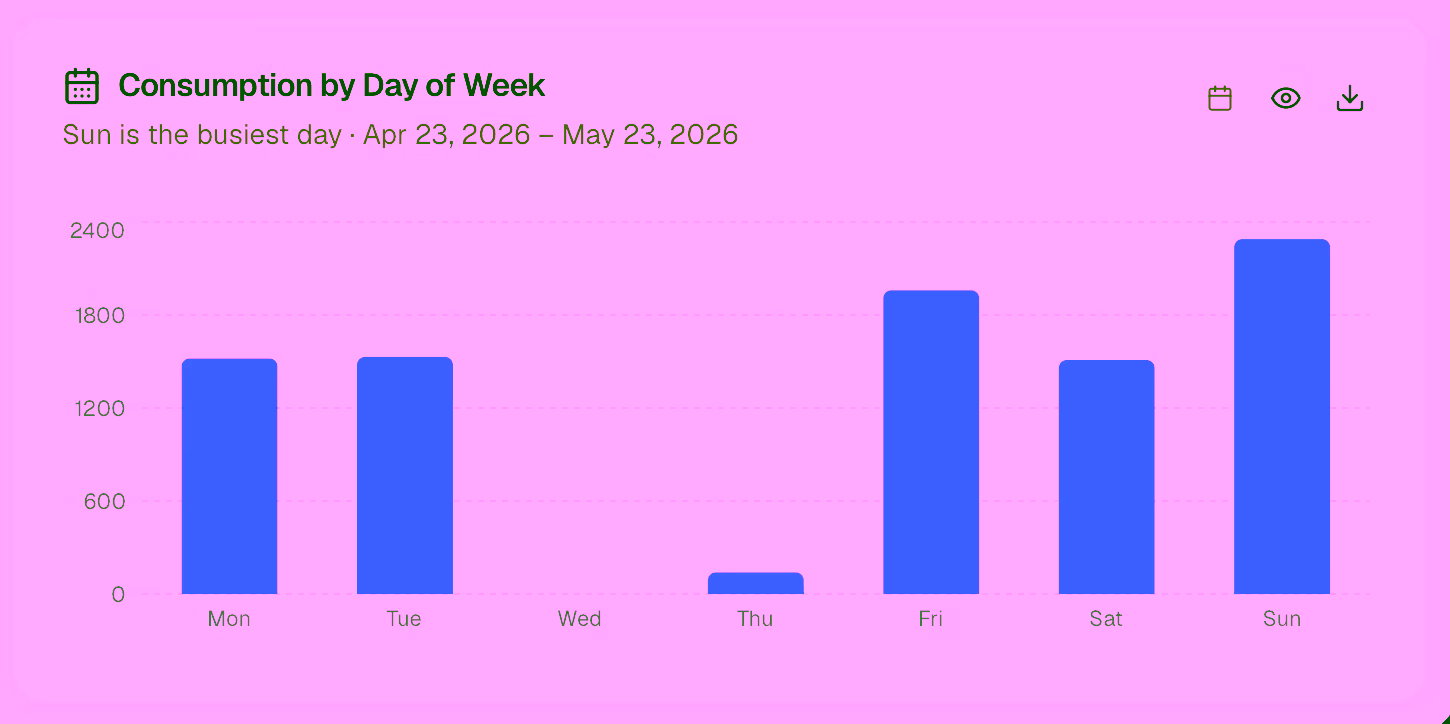
Day-of-Week Breakdown
Shows which days of the week have the highest consumption. Helps you plan delivery and restocking around your busiest days.
Changing the Date Range
Use the date picker in the top-right corner of the page to adjust the analysis window. The default is the last 30 days.
Preview the report
You can preview and download each report for further processing.